Forecasters of the energy transition keep making the same mistake: radically underestimating the pace of change. Events of the last week show that the transition will continue to accelerate. To get ahead of the game, we need to think in curves instead of straight lines. Investors need to learn quickly, or else they will lose heavily.

Consistently wrong in the same direction
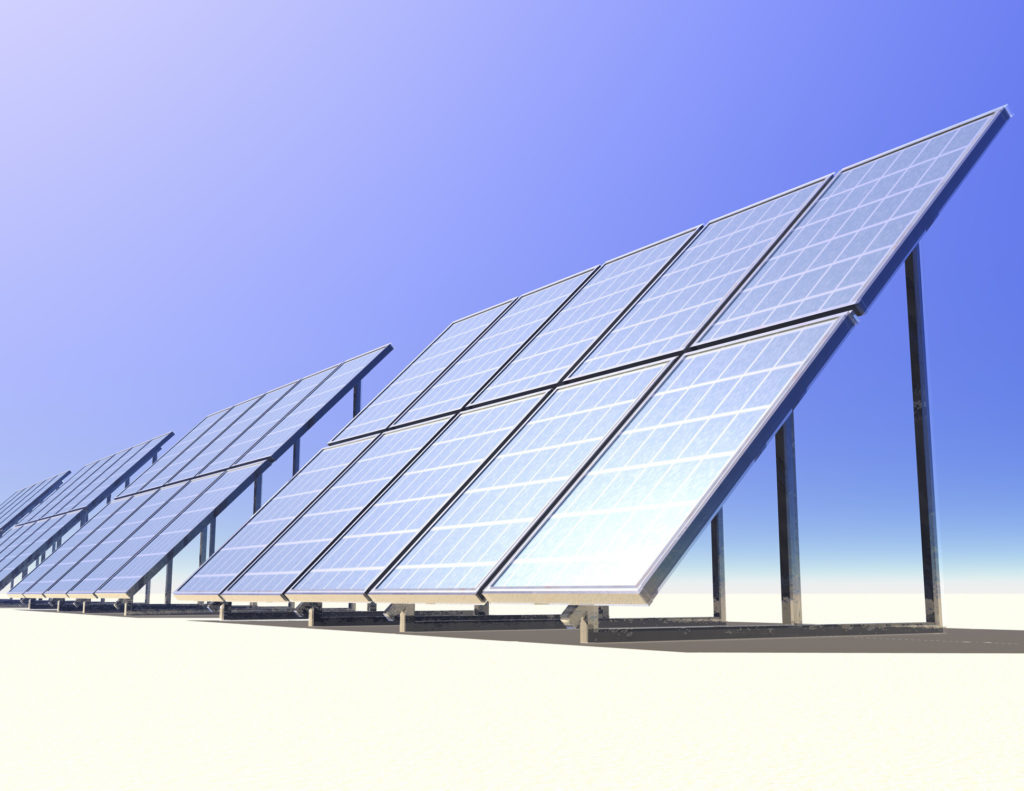
Back in 2006, experts projected that global deployment of solar photovoltaics would reach 50 GW by 2020. Just a decade later, that projection was revised up to 500 GW. Here we are in 2020, and global deployment of solar PV is more like 600 GW: over ten times higher than expected.
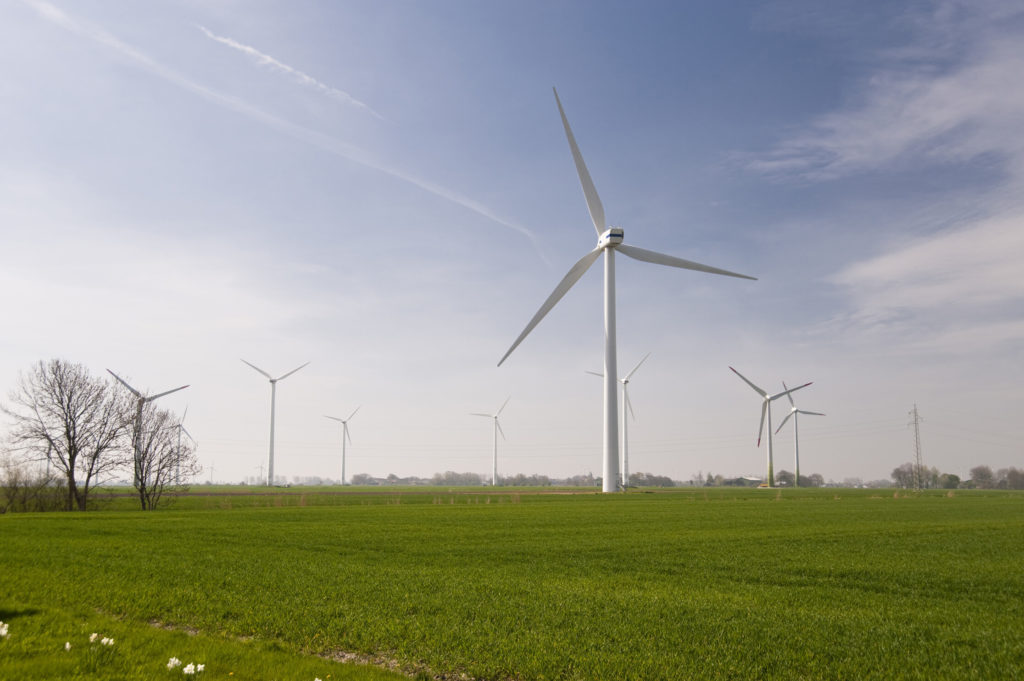
Projections for onshore wind power have fared similarly. As for offshore wind, in 2014 economists told us it was ‘among the most expensive ways of marginally reducing carbon emissions known to man’. Just six years later, the latest contracts in the UK are expected to produce offshore wind power that is 30% cheaper than power from gas.
In 2012, Bloomberg New Energy Finance projected that global power generation from coal would peak in the 2040s. Just eight years later, BNEF’s revised projection for peak coal power is…last year!

Seeing the pattern
As anyone who has done a school science experiment knows, if you are always wrong in the same direction, you probably have a systematic error, not a random one.
The mistake we keep making is to think in straight lines. Economics traditionally assumes diminishing returns: the more effort you put into something, the less additional benefit you get. But as Brian Arthur has written, new technologies tend to experience the opposite dynamic: increasing returns on investment. An improving technology attracts greater demand, incentivising more investment, leading to further improvement. Positive feedbacks like this lead to exponential growth.
This is why governments’ targets are a poor guide to the future. When a technology gets better, they will want more of it. In 2008, China planned barely any solar deployment by 2020; six years later, it was aiming for around 100 GW. In the intervening period, the cost of solar had halved, and China’s increasing production of solar panels had seen its share of the global market roughly double.
As a new report shows, the growth of renewable power fits the pattern of an ‘S-curve’ of technology adoption. Understanding it this way makes the future more foreseeable.

Don’t be surprised if you’re stranded
Last week, Japan and Korea joined China in committing to net zero emissions, meaning that the three countries that provide almost all international finance for new coal plants are now effectively committed to removing coal power from their own economies. The Philippines announced a moratorium on new coal, adding to the trend that has seen nearly 900 GW of planned new coal plants cancelled over the last five years.
The 500 GW of new coal plants still planned now look like not only the worst thing anyone can do for climate change, but also one of the worst investments anyone can make. As it’s already becoming cheaper to install new solar and wind plants than to keep running existing coal plants, new coal plants risk becoming stranded assets before they are even built. Half a trillion dollars could be wasted, by one estimate.
The COP26 Energy Transition Council will work to ensure that for every country considering new power generation, clean power is the most attractive option. We’re calling on all investors: dump coal, like KEPCO did last week, and join us in scaling up clean power instead.
This article was first published at https://www.linkedin.com/pulse/expecting-exponential-seeing-pattern-energy-could-save-simon-sharpe/.